About Me
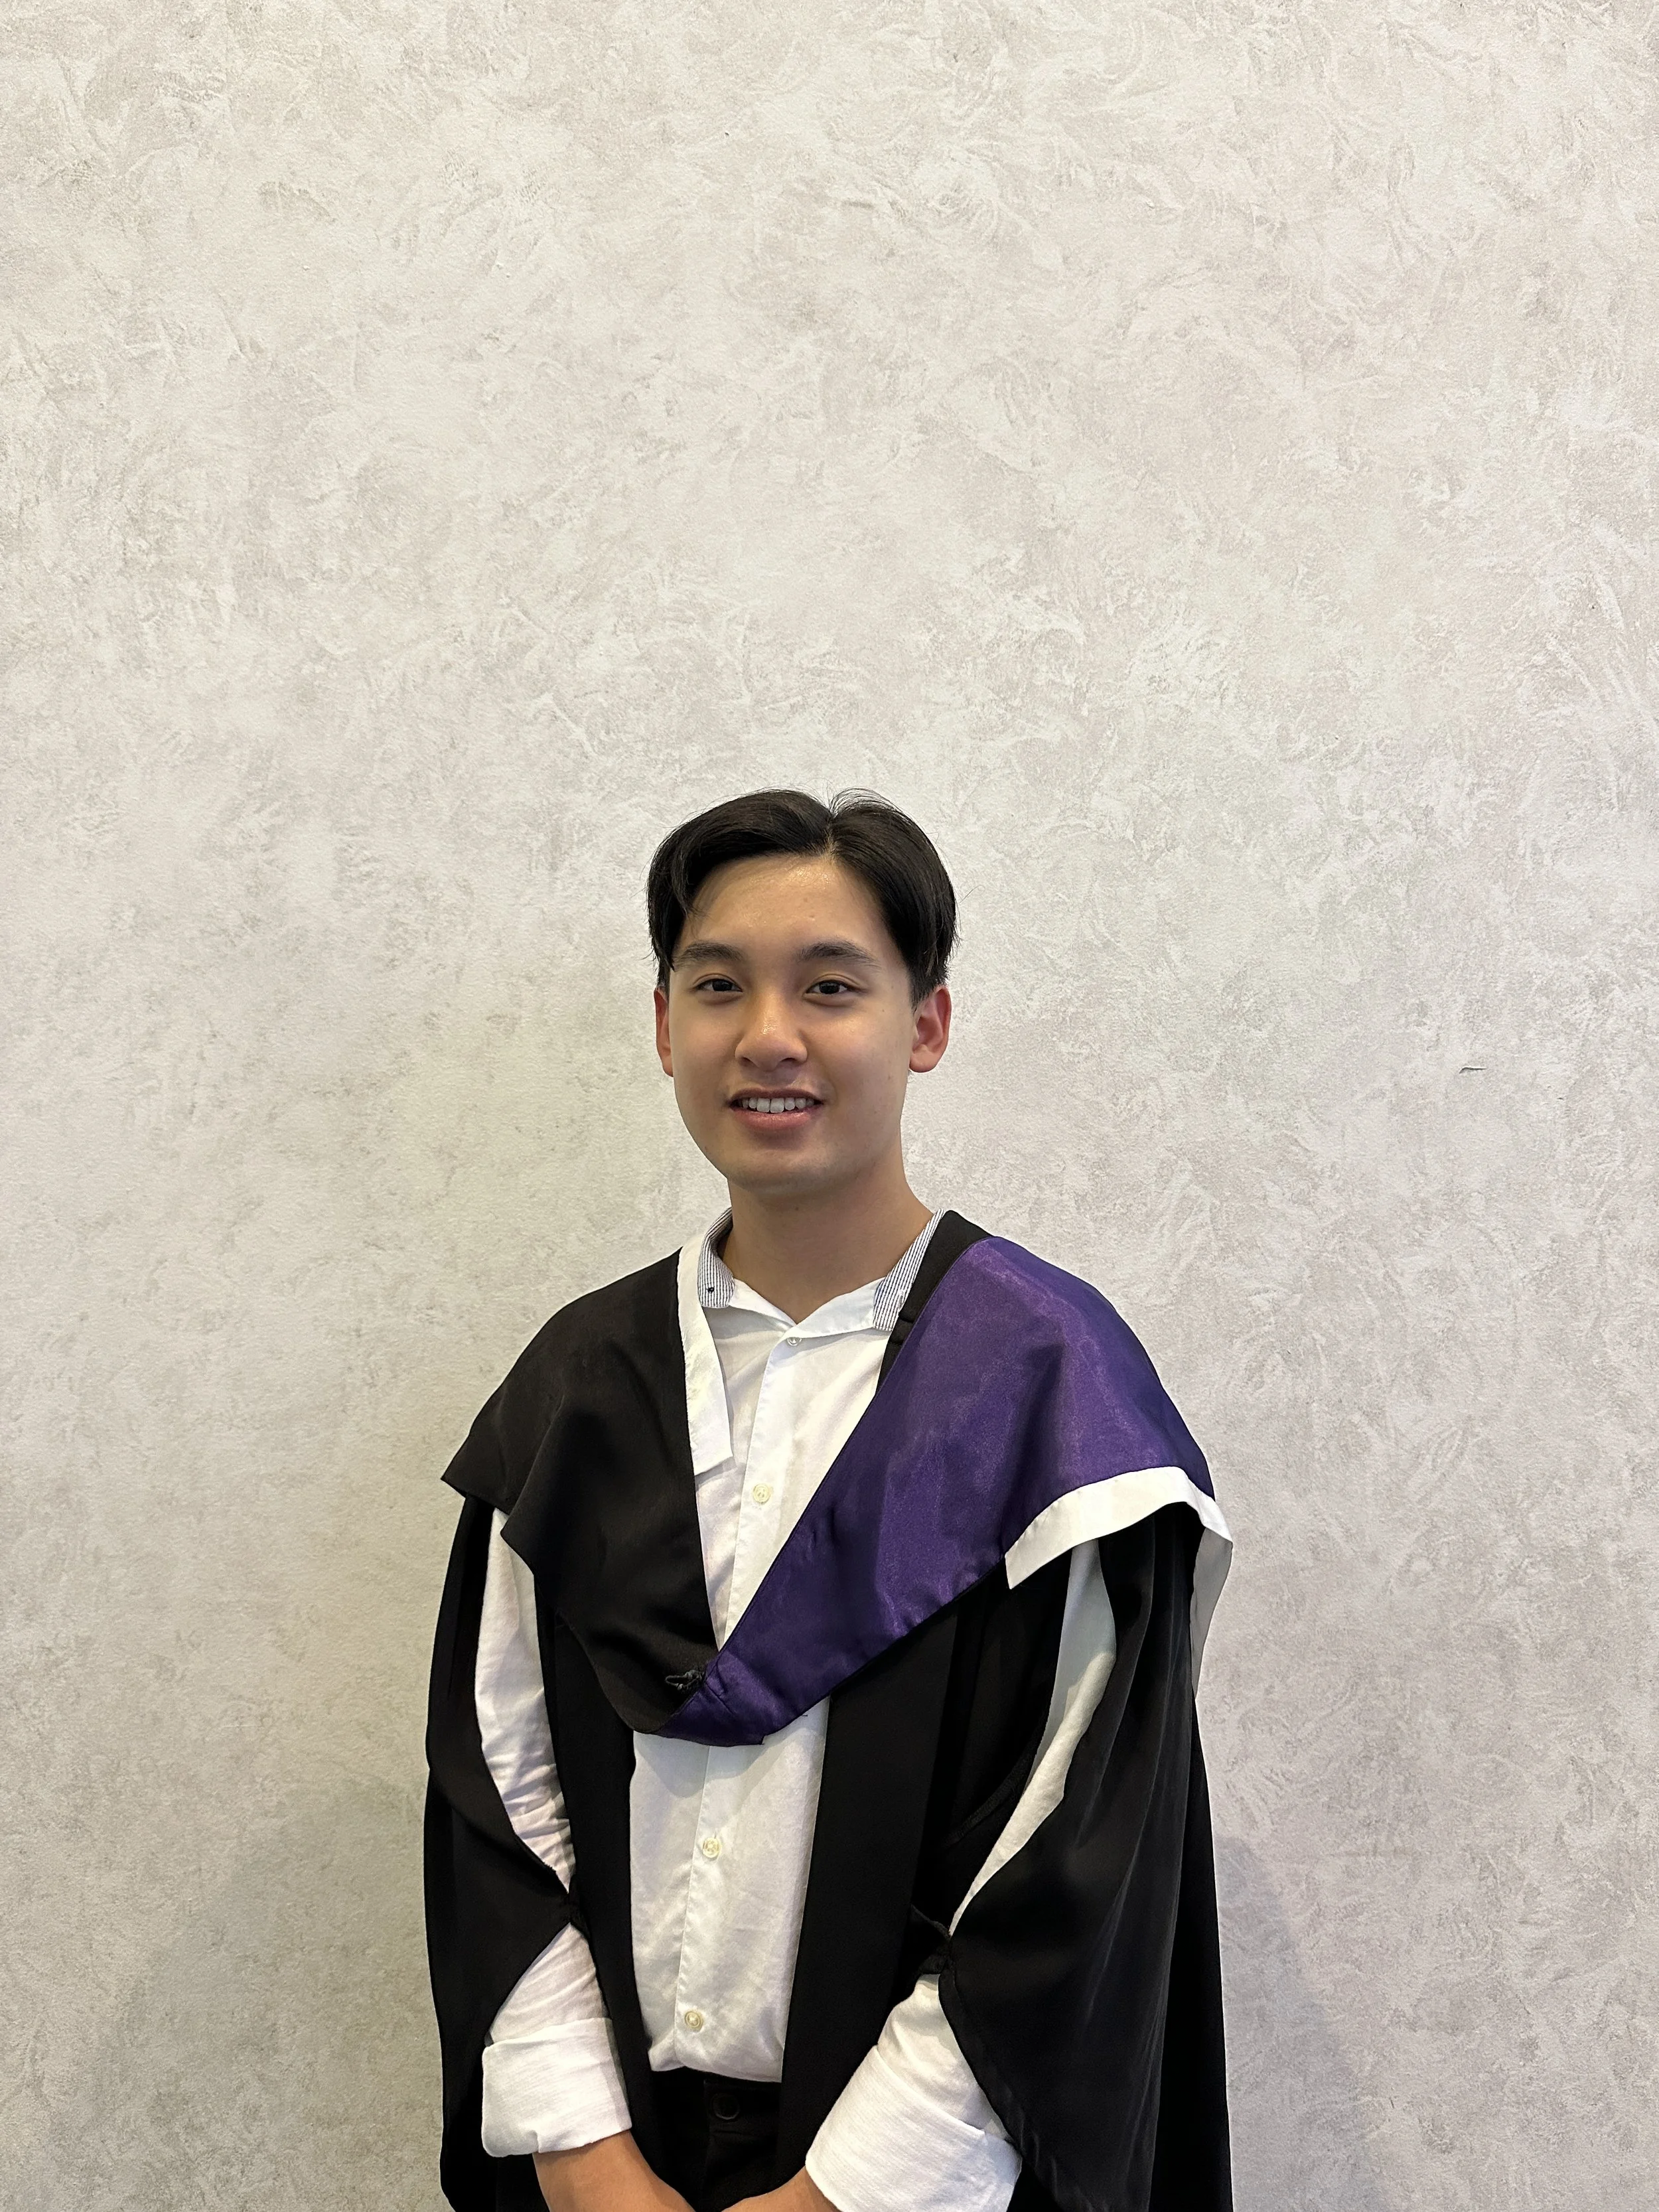
Hi, I’m Ryan.
I am a Monash University graduate with a background in Software Engineering and Data Science. I enjoy the challenge of bridging the gap between technical systems and practical insights, whether that involves engineering a database or analysing data to support better decision-making.
Through my internship as a Junior Associate at IBM and my leadership roles with AIESEC, I have developed a mix of technical and coordination skills. I am comfortable working with SQL and data visualisations, but I also value the operational side of a role such as managing project logistics and collaborating with a team to hit targets.
I am currently looking for graduate opportunities where I can apply my analytical mindset and technical foundation to help solve real-world problems.
Work Experience
Junior Associate (Intern) - IBM
Aug 2022 - Nov 2022
Grocery Team Member - Woolworths
May 2024 - Present
Sushi Preparer & Sales Assistant - Sushi Sushi
Dec 2021 - Feb 2024
Cafe Barista - McDonald’s
Aug 2021 - Dec 2021
Leadership and Volunteering Experience
Marketing Lead - AIESEC Australia
Aug 2022 - Jan 2023
Program & Events Coordinator - AIESEC Australia
Feb 2022 - Jul 2022
Portfolio
This portfolio features projects completed as part of my Data Science studies. Each project explores real-world questions using data analysis and visualisation. From understanding Melbourne’s café landscape to examining public transport accessibility, these works demonstrate my ability to extract insights, build interactive tools, and communicate results clearly.
Exploring the Distribution of Dining Spots in Melbourne
This project, developed using R Shiny, investigates Melbourne’s café and restaurant landscape through interactive data visualisations. By analysing the relationship between location, price levels, and customer satisfaction, it highlights trends in dining density, affordability, and quality across different suburbs.
Key features include a Leaflet-based map of venue locations, interactive bar and scatter plots, and dynamic controls such as a suburb filter and year slider, allowing users to explore how Melbourne’s dining scene has evolved over time. The dashboard offers valuable insights for both consumers and hospitality business owners.
Tools & Skills Used:
R Shiny, Leaflet, ggplot2, Plotly, dplyr
Data wrangling and cleaning
Interactive dashboard design
Visual storytelling with user-centred design principles (FDS, Gestalt, colour theory)
Analysing Public Transport Accessibility in Melbourne
This project explores accessibility gaps in Melbourne’s public transport network using spatial data analysis and visualisation. Focusing on the post-COVID context, it identifies suburbs with limited or no access to bus, tram, or train services, providing insights for future planning and infrastructure improvements.
The project uses spatial queries to calculate stop density across mesh blocks and identify underserved regions. Choropleth maps created in QGIS highlight coverage disparities across Melbourne, offering a clear view of transport inequality and network strengths.
Tools & Skills Used:
PostgreSQL with PostGIS, QGIS
GTFS data processing and ASGS mesh block mapping
SQL-based spatial analysis and stop density computation
Data cleaning, spatial joins, and choropleth visualisation
Urban accessibility assessment and report writing
Certifications
Jul 2024
Nov 2022
Oct 2022
Sep 2022
Aug 2022
Aug 2022
Aug 2022

